City Risk Score

Flood, earthquake, cyclone, wildfire, heat and air quality risk for the world's cities, computed from public scientific datasets and published with the method in the open.

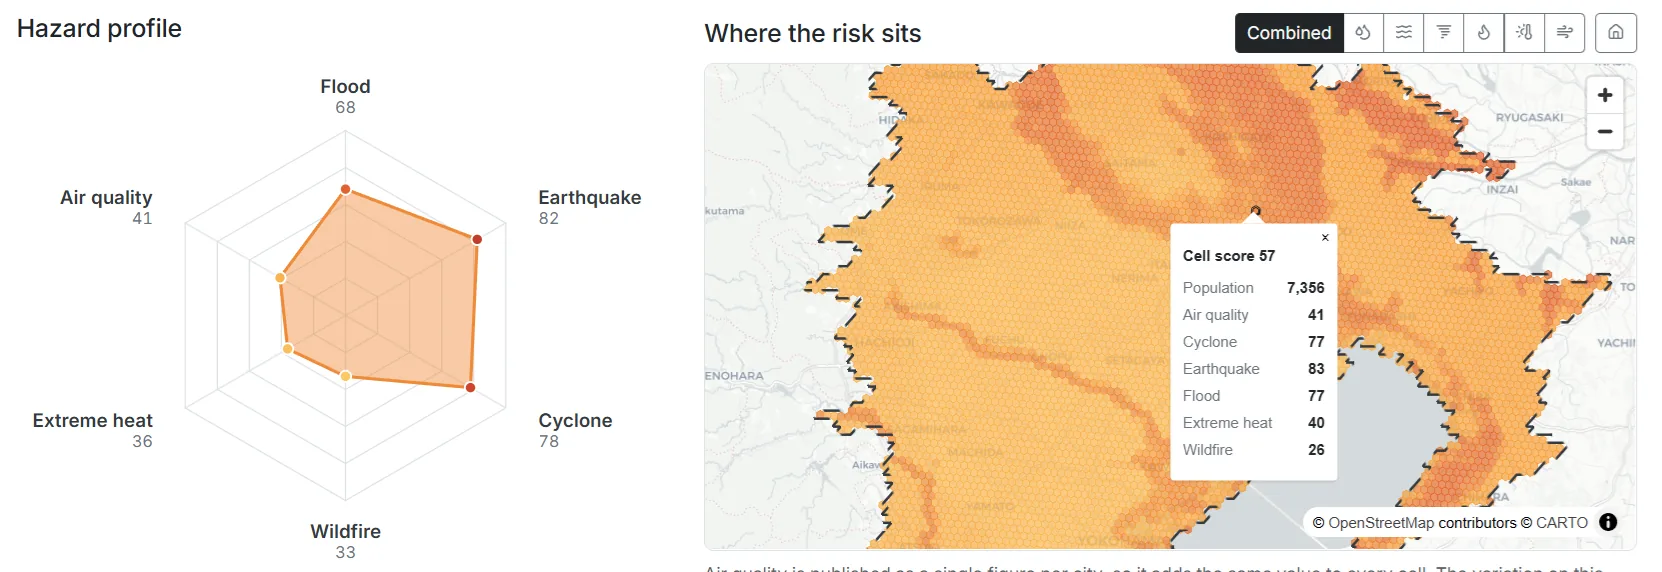
Every number on this site is computed from public scientific datasets by an open pipeline, on a roughly one-kilometre grid, weighted by where people actually live. The scales are fixed in advance, so a city's score never changes because another city was added.

Latest See all

Where these cities are

One dot per city, coloured by its overall score. Click one for its figure and a link to the page.

Loading the map…

The map could not be loaded. The list below works without it.

Cities (100)

These are absolute scores on a scale fixed in advance, not a ranking tournament between cities - see the methodology for what they do and do not mean.

No city on this list matches that.

Common questions

What a reader usually needs answered before trusting a number like this. The methodology page carries the full detail.

What does a city's score actually mean?
Physical hazard exposure on a 0-100 scale, measured across the city's built-up area on a roughly one-kilometre grid and weighted by where people live. Each of the six indicators is measured in its own physical unit first - flood depth, observed shaking, cyclone intensity - and then mapped onto a fixed scale that does not depend on which other cities happen to be published.
How is the overall score calculated?
An equal-weighted mean of whichever indicators could be measured for that city. An indicator with no usable data is dropped from the mean rather than counted as zero, because "we have no data here" and "nothing happens here" are different statements. The methodology gives every formula and every threshold.
Does a high score mean a disaster is coming?
No. These are exposure figures, not forecasts: they describe the hazard a place is subject to, not what will happen or when. Nothing here is reliable about an individual street or building, and none of it is advice for a personal or commercial decision.
Do the scores account for flood defences or emergency services?
No, and it is the most important limitation to carry with any of these numbers. Both flood models are undefended - they simulate water without levees, sea walls or pumping - because no global dataset of flood defences exists at usable quality. A city that has spent decades on flood engineering scores the same as one that has not.
Where does the data come from?
Public scientific datasets only: river flood from the JRC's GloFAS maps, coastal flood from WRI Aqueduct, earthquakes from the USGS catalogue, cyclone tracks from NOAA's IBTrACS, fire detections from NASA FIRMS, heat from CHELSA, and air quality and city boundaries from the JRC's Global Human Settlement urban centre database. Each is credited with its licence on the data and licences page.
Why is my city not here?
There are 100 cities so far and the list grows in batches; the grey cards above are the ones queued next. Coverage is limited by the source data as much as by time - a city has to appear in the global urban centre database and be reached by every hazard layer, and a few candidates have been dropped because one layer did not cover them.
How often is this updated, and can a city's score change?
Adding a city never changes another city's score: the scales are absolute and versioned, not normalised across whichever cities are published. The underlying datasets are mostly multi-year climatologies that change rarely, and the site is rebuilt when a source publishes new data or a city is added. Each city page carries the timestamp it was generated from.
Can I reuse these numbers?
Yes. Every city page links the raw JSON and the per-hexagon GeoJSON behind it, and offers an embeddable badge. Please cite the original data publishers rather than this site - the scores are a derived product and the science is theirs - under the terms listed on the data and licences page.

What is measured

River and coastal flooding, earthquakes, tropical cyclones, wildfire in the vegetation around the city, extreme heat and air quality. Each is measured in its own physical unit first, then mapped onto a 0-100 scale.

What is not

Flood defences, building codes, emergency services and insurance. The scores describe the hazard a place is exposed to, not how well it is prepared - global data on preparedness does not exist at a usable quality.

Check the working

The methodology gives every formula and every threshold, and each city page links the raw JSON behind it. Disagree with a weighting? The per-hazard scores are all there.