Where these cities are
One dot per city, coloured by its overall score. Click one for its figure and a link to the page.
Loading the map…
The map could not be loaded. The list below works without it.
Cities (100)
These are absolute scores on a scale fixed in advance, not a ranking tournament between cities - see the methodology for what they do and do not mean.
No city on this list matches that.
Common questions
What a reader usually needs answered before trusting a number like this. The methodology page carries the full detail.
What does a city's score actually mean?
How is the overall score calculated?
Does a high score mean a disaster is coming?
Do the scores account for flood defences or emergency services?
Where does the data come from?
Why is my city not here?
How often is this updated, and can a city's score change?
Can I reuse these numbers?
What is measured
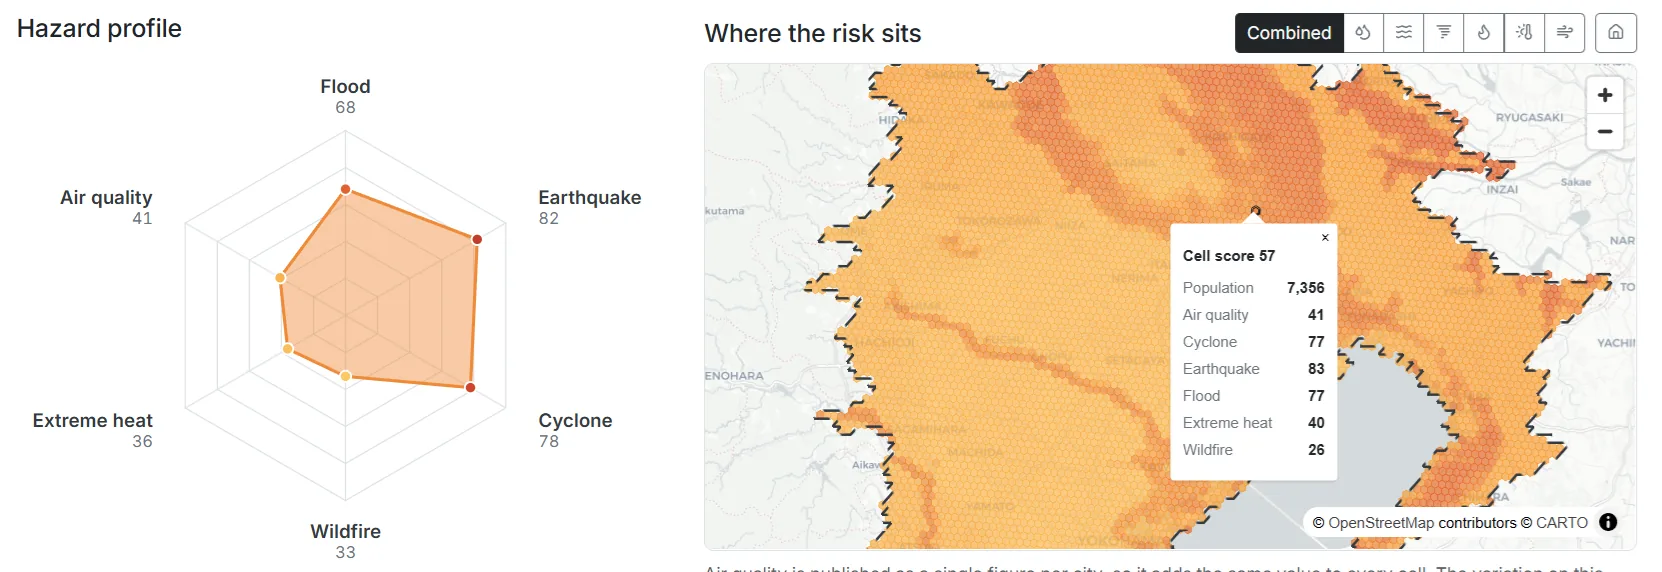
River and coastal flooding, earthquakes, tropical cyclones, wildfire in the vegetation around the city, extreme heat and air quality. Each is measured in its own physical unit first, then mapped onto a 0-100 scale.
What is not
Flood defences, building codes, emergency services and insurance. The scores describe the hazard a place is exposed to, not how well it is prepared - global data on preparedness does not exist at a usable quality.
Check the working
The methodology gives every formula and every threshold, and each city page links the raw JSON behind it. Disagree with a weighting? The per-hazard scores are all there.